|
Date
|
Topics
|
Class Activities
|
Assignments
|
|
1/15
|
Chapter 1 - Picturing Distributions With Graphs1.1 Introduction to Statistics, Variables, and Data
Identify variables and individuals in studies
Distinguish Categorical and Quantitative Variables
Decide whether a variable is valid
1.2 Pie Charts and Bar Graphs
Create and interpret Bar Graphs and Pie Charts
|
Lecture slides
WS Handout: 1-1, 1-2, 1-4, 1-6
Graph of the Day:
http://voices.washingtonpost.com/ezra-klein/2010/12/american_misperceptions_of_for.html
Dolphin Study
Randomization Applet
|
Read syllabus
Register for Stats Portal
Read Chapter 1 -- Take notes while you read and work out the examples in the readings. Write down any questions you may have on the material.
Do the Check Your Skills problems (1.13 - 16)
|
| 1/17 |
1.3 - 1.5
Graphs for Distributions of Quantitative Variables
Construct and interpret
dotplots,
histograms,
stemplots,
timeplots |
Graph of the Day:
http://en.wikipedia.org/wiki/File:World_religions_pie_chart.png
Plot #states visited on a dotplot
Construct stemplot and histogram of states
Enter state data in statcrunch
Example data sets:
Compare in Statcrunch with regard to tendency and consistency
FebTemps
Seatbelt (compare study design to dolphin study)
Discuss key features: center. spread, shape, peaks and clusters, outliers
7-1 to 7-3
|
Complete graded assignment #1 in StatsPortal. (You will have 3 attempts to do this assignment. Your score will be the average of the 3 attempts.)
Review all the terms in the Chapter 1 summary
Read Chapter 2 |
| |
|
|
|
| 1/22 |
Chapter 2 - Describing Distributions With Numbers
Measures of Center: Mean and Median
|
Graph of the day:
http://blogs-images.forbes.com/naomirobbins/files/2012/08/Bush_cuts2.png
Do 7-4,5
Typical Class Sizes
Measures of Center 8-1, 8-2, 8-3, 8-4, 8-5, 8-7
Graph of the Day:
|
Graded Assignment #1 Due
Review all the terms in the Chapter 2 summary
Do AYK questions: 2.1 - 2.14 (or just the ones where the answers are given)
|
|
1/24
|
Measures of Spread: range, IQR,
standard deviation
The 5-Number Summary
|
Why your friends (probably) have more friends than you do
do not cross a river that is on average 4 feet deep
Measures of Spread
9-1, 9-2, 9-3,4
demo uploading data for 2.46
|
Read Chapter 3
Do 3.1-3.14 (or just the ones where the answers are given)
|
| |
|
|
|
|
1/29
|
Boxplots
Identifying Suspected Outliers
|
Graph of the day
http://go.bloomberg.com/multimedia/americas-growing-income-gap-shows-two-recoveries-in-action/
http://www.globalrichlist.com/
do 9-5,6
Boxplots
10-1, 10-2, 10-3
Backpack weights analysis in statcrunch
|
Complete Graded Assignment #2
Read ch 3
|
|
1/31
|
Chapter 3 -
The Normal Distribution
Finding the area under the curve
Finding the value for a given proportion or percentile
|
Graph of the day:
Jurassic Park Graphs
Normal Curve Calculation examples
Normal Distribution
Do 12-1, 12-2, 12-4
|
Graded Assignment #2 Due
read ch 4
|
| |
|
|
|
| 2/5 |
Chapter 4 - Scatterplots and Correlationdescribe the direction, strength, and form of an association
compute and interpret the correlation coefficient |
correlation cartoon
review normal curve calculations
Scatterplots
Do 26-1 through 26-6
Correlation
Do 27-1 through 27-5
|
Play "guess the correlation" (27-4)
Read Chapter 4
Do 4.1 to 4.13
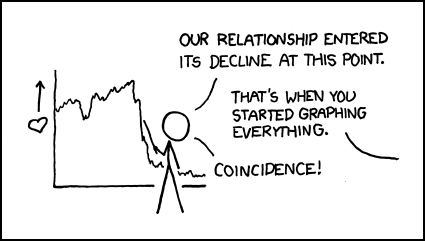
xkcd cartoon
work on graded assignment #3
|
|
2/7
|
Chapter 5 - Regression
|
Cancer rates and small schools
WS 28-1 to 28-4
Regression app
Line of best fit
SPSS regression notes
SAT scores by state part 1
|
xkcd cartoon
Check Your Skills Problems for ch 1-4
exam 1 review with answers.pdf
Exam 1 study guide
|
| |
|
|
|
|
2/12
|
|
Graph of the day
http://en.wikipedia.org/wiki/File:Prisoner_population_rate_world_map.png
Review for Exam 1
MLB data
example for normal curve calculations
http://www.ted.com/talks/lang/en/eric_mead_the_magic_of_the_placebo.html
|
Graded Assignment #3 Due
Read Chapter 5
Do 5.1 - 5.16
xkcd cartoon
|
|
2/14
|
EXAM #1
|
Covers Chapters 1 through 4
|
|
| |
|
|
|
|
2/19
|
More Regression Considerations
R squared
|
Graph of the Day:
http://graphjam.files.wordpress.com/2011/11/funny-graphs-what-about-the-hipsters-that-use-bing-ironically.png
demo influential points and nonlinear patterns
SAT by state
part 2
applet
AZT and HIV
|
exam 1 with answers.htm
complete graded assignment #4
Read Chapter 6
|
|
2/21
|
Chapter 6 - Two Way Tables
Chapter 8: Producing Data: Sampling |
Race and the Death Penalty
Hypothetical Hospital Recovery Rates
Observational Studies and Bias in Sampling
WS topic 3-1, 3-3, 3-4 |
do AYK 6.1 - 6.7
Read Chapter 8
|
| |
|
|
|
|
2/26
|
Chapter 9: Producing Data: Experiments
|
Graph of the Day:
http://www.nationmaster.com/graph/eco_pop_bel_med_inc-economy-population-below-median-income
JellyBlubbers
Statistical Darts
Memorizing Letter Sequences
|
Graded Assignment #4 Due
Do AYK 8.1-8.15
|
|
2/28
|
|
Graph of the day:
http://www.theatlantic.com/business/archive/2012/06/hey-everyone-dont-fall-for-this-misleading-graph-about-college-costs/258299/
design an experiment to test the efficacy of prayer
Graph of the Day: STEP experiment.pdf
How big is your family.pptx
Yawning
Myth Busters
video clip
WS 5-1 to 5-4
Kramer in Strength Shoes
Randomization of Subjects Applet
Monty Hall Problem in 21 Movie
|
complete graded assignment #5
Read Chapter 9
Do all AYK's from ch9
|
| |
|
|
|
| |
spring break |
|
|
| |
|
|
|
| 3/12 |
Chapter 10:
Probability
Law of Large Numbers: in a large number of trials, the average will be close to the expected value
|
Graph of the Day:
Daylight Savings Time:
weather NYC 09.docx
Powerpoint Ch 10
Fair Game? (Spinner)
Expected Value for SAT guessing
law of large numbers.docx
Monty Hall explanation
Probability examples using deck of cards
Expected Value for Roulette versus lottery
How to win at roulette
Rolling Dice Probability Distribution
Discrete Versus Continuous distributions (uniform, normal)
Law of Large Numbers versus Law of Averages
collect data for anchoring effect
|
Read Ch 10
Do all AYK's in Ch 10
|
|
3/14
|
Chapter 11:
Sampling Distributions
|
misleading graph.pptx
The Texas Sharpshooter’s Fallacy.pptx
Sampling Pennies Applet
WS 14-1 to 14-2
|
Read Ch 11 and do all AYK's
Do exam 2 review in stats portal
|
| |
|
|
|
|
3/19
|
|
Review for Exam 2
Exam 2 Topics
misleading graph2.pptx
Linda is a bank teller.pptx
|
Graded Assignment #5 Due
Do Check Your Skills problems for chapters 5,6,8,9,10 as review problems
|
|
3/21
|
exam 2
|
Covers Chapters 5,6,8,9,10
|
|
| |
|
|
|
|
3/26
|
Chapter 12:
Probability Rules
Probability models: tables, tree diagrams, area diagrams
|
misleading graph3.pptx
onion graph.docx
go over test
Probability Rules
30-1, 30-2
"one and one"
30-3,4,5
|
Read Chapter 12
and do all AYK's
Read Ch 13 and do all AYK's
|
|
3/28
|
|
No class
|
|
| |
|
|
|
|
4/2
|
Chapter 13:
Binomial Probability Distribution
|
socks.pptx
Medical Diagnosis
ELISA test
How Statistics Fool Juries
-If the Phillies have a 60% chance of beating the Cardinals on any game, what is the probability that they lose a five game series?
|
xkcd cartoon
Read 566-579 and do AKY questions
Complete Graded Assignment #6 for Thursday
|
|
4/4
|
Chapter 14:
Confidence Intervals
|
misleading graph4.pptx
ch 11 examples
Binomial Probability Notes
ESP test
Ch 14 lecture slides
|
Graded Assignment #6 Due
Read ch 15 and do all AKY questions
|
|
|
|
|
|
|
4/9
|
Chapter 15:
Tests of Significance
|
xkcd cartoons.pptx
Continue Ch 14 lecture slides
Simulating Confidence Intervals
Ch 15 Lectures slides
Hypothesis tests
|
Exam 3 Practiced test to be posted on 4/10
Exam 3 Content
Chapters 11-15
|
|
4/11
|
|
Introduce Final Project Due 5/6
review for exam 3
|
|
| |
|
|
|
|
4/16
|
EXAM #3 |
Covers Chapters 11, 12, 13, 14, 15
|
do the Check Your Skills problems for review
Graded Assignment #7 Due
|
|
4/18
|
Chapter 16: Inference in Practice
|
Graph of the Day:
http://www.babynamewizard.com/
Bonus GOTD
Go over test
project ideas?
Dolphin Study
Memorizing Letter Sequences
Anchoring Experiment
Example z-test, z-interval:
Suppose that in a particular geographic region, the mean and standard deviation of scores on a reading test are 100 points, and 12 points, respectively. Our interest is in the scores of 55 students in a particular school who received a mean score of 96. We can ask whether this mean score is significantly lower than the regional mean — that is, are the students in this school comparable to a simple random sample of 55 students from the region as a whole, or are their scores surprisingly low?
|
Read Chapter 16
Come up with an idea for an experiment you could carry out for your project.
|
|
|
|
|
|
| 4/23 |
|
Graph of the Day
healthcare.docx
Example: BodyTemps data in statcrunch
"Does the average body temperature of healthy adults differ from 98.6?" Run a z-test!
"Do males and females differ with regard to to average body temperature?"
Run a randomization test!
Statcrunch>Applets>Resampling>Randomization Test for Two Means
Ch 16 slides
Balance of Type I and Type II errors in criminal courts, welfare, pregnancy test, drug test, test for a disease, etc.
Statistical Power
Reaction time app:
http://www.bbc.co.uk/science/humanbody/sleep/sheep/reaction_version5.swf
Construct boxplots comparing dominant versus non-dominant hand average times
Course/Teacher Evaluations
|
|
| 4/25 |
|
Graph of the Day:
http://web.ncf.ca/jim/ref/inconvenientTruth/index.html
Last day of class!!!
Topics to Review for Final Exam
|
Final Exam Review 118.docx
Final Exam Review 118 answers.docx
|
| |
|
|
|
| 4/30 |
|
no class
|
|
| 5/2 |
|
no class
|
|
| |
|
|
|
5/6
|
FINAL EXAM |
Final Project Due 5/6
Final exam is cumulative
The exam is on Monday 5/6 at 11:30 am in MH 316
|
Graded Assignment #8 due (optional)
****************************************
Final Exam 118 spring 2013 answers.docx
|
Comments (0)
You don't have permission to comment on this page.